Your most essential tool as an Preconstruction Manager/ Estimator is going to be your Estimating Spreadsheet. Now, what is this spreadsheet?
The estimating spreadsheet is the summary of all information available to you from a cost perspective, which is systematically organized for everyone’s understanding. You will find Scheduling, Unknowns (this is also information) and Risk reflected here through pricing as well. A “sloppy” developed spreadsheet can cost you the project or make the execution of the project from the beginning horrible – I mean for real!
The spreadsheet can be anything, from handwritten notes, fully elaborated excel spreadsheets to automatic software programs. Different companies chose to use different tools. The point is to have all information in an organized fashion. For our purposes we will be using a simple excel spreadsheet.
You will share with your client a concise version of the spreadsheet as part of a submission package. This version will usually include summarized pricing, and will exclude sensitive information and information that can put you in a competitive disadvantage.
The Spreadsheet
Your Spreadsheet should always show at the beginning important internal project information. What is considered as important is different for every company. Our spreadsheet contains the date the spreadsheet was submitted to the client, your company’s internal project number (so you can look up your project again when needed), the project type (we will classify the project as private, commercial, new construction and speculative warehouse), and the estimating type (defining the accuracy and effort put into an estimate).
There are a lot of classification systems available to help you classify the type of project and the type of estimate. Whatever Classification system you end up using, what really matters is that your objectives are clear (purpose and accuracy of the estimate). Wikipedia has a lot on information on how to classify your estimate. In our fictitious case study, we will classify our estimate as “Scope Estimate“. We need to identify the “Scope of Work” of this project (especially quantities) in order to be able to verify bids from potential subcontractors. We want to make sure we have All the Work included first, and then we will study the pricing!

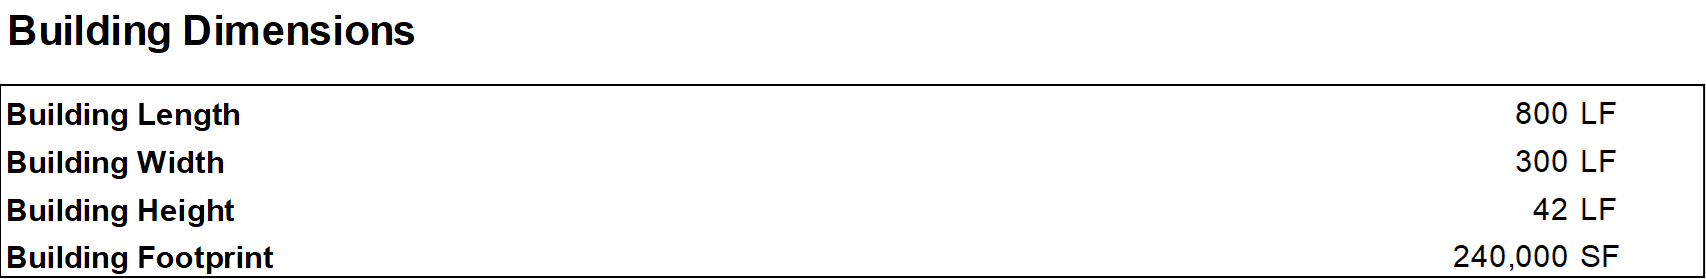
Next, we should have information on Building Dimensions readily available, such as Building length, width, and building footprint.
Now comes the main part of your spreadsheet – the Scope of Work. What you see below is an example of how you can organize your Scope of Work section. Your company will probably have their own version of it.
In construction, the Construction Specifications Institute (CSI) MasterFormat is a widely used standard for organizing specifications, and other written information, and commonly used in USA and Canada. It initially divided all construction related items into (16) Divisions, but was expanded in 2004 to (50) Divisions, due to changes in construction technology, new innovations, new building materials, etc.
We are using the 50 Division MasterFormat to organize all our information. Check out the complete 50 Divisions MasterFormat, which is readily available for download. Our Spreadsheet lists some of the most common construction divisions for residential building.
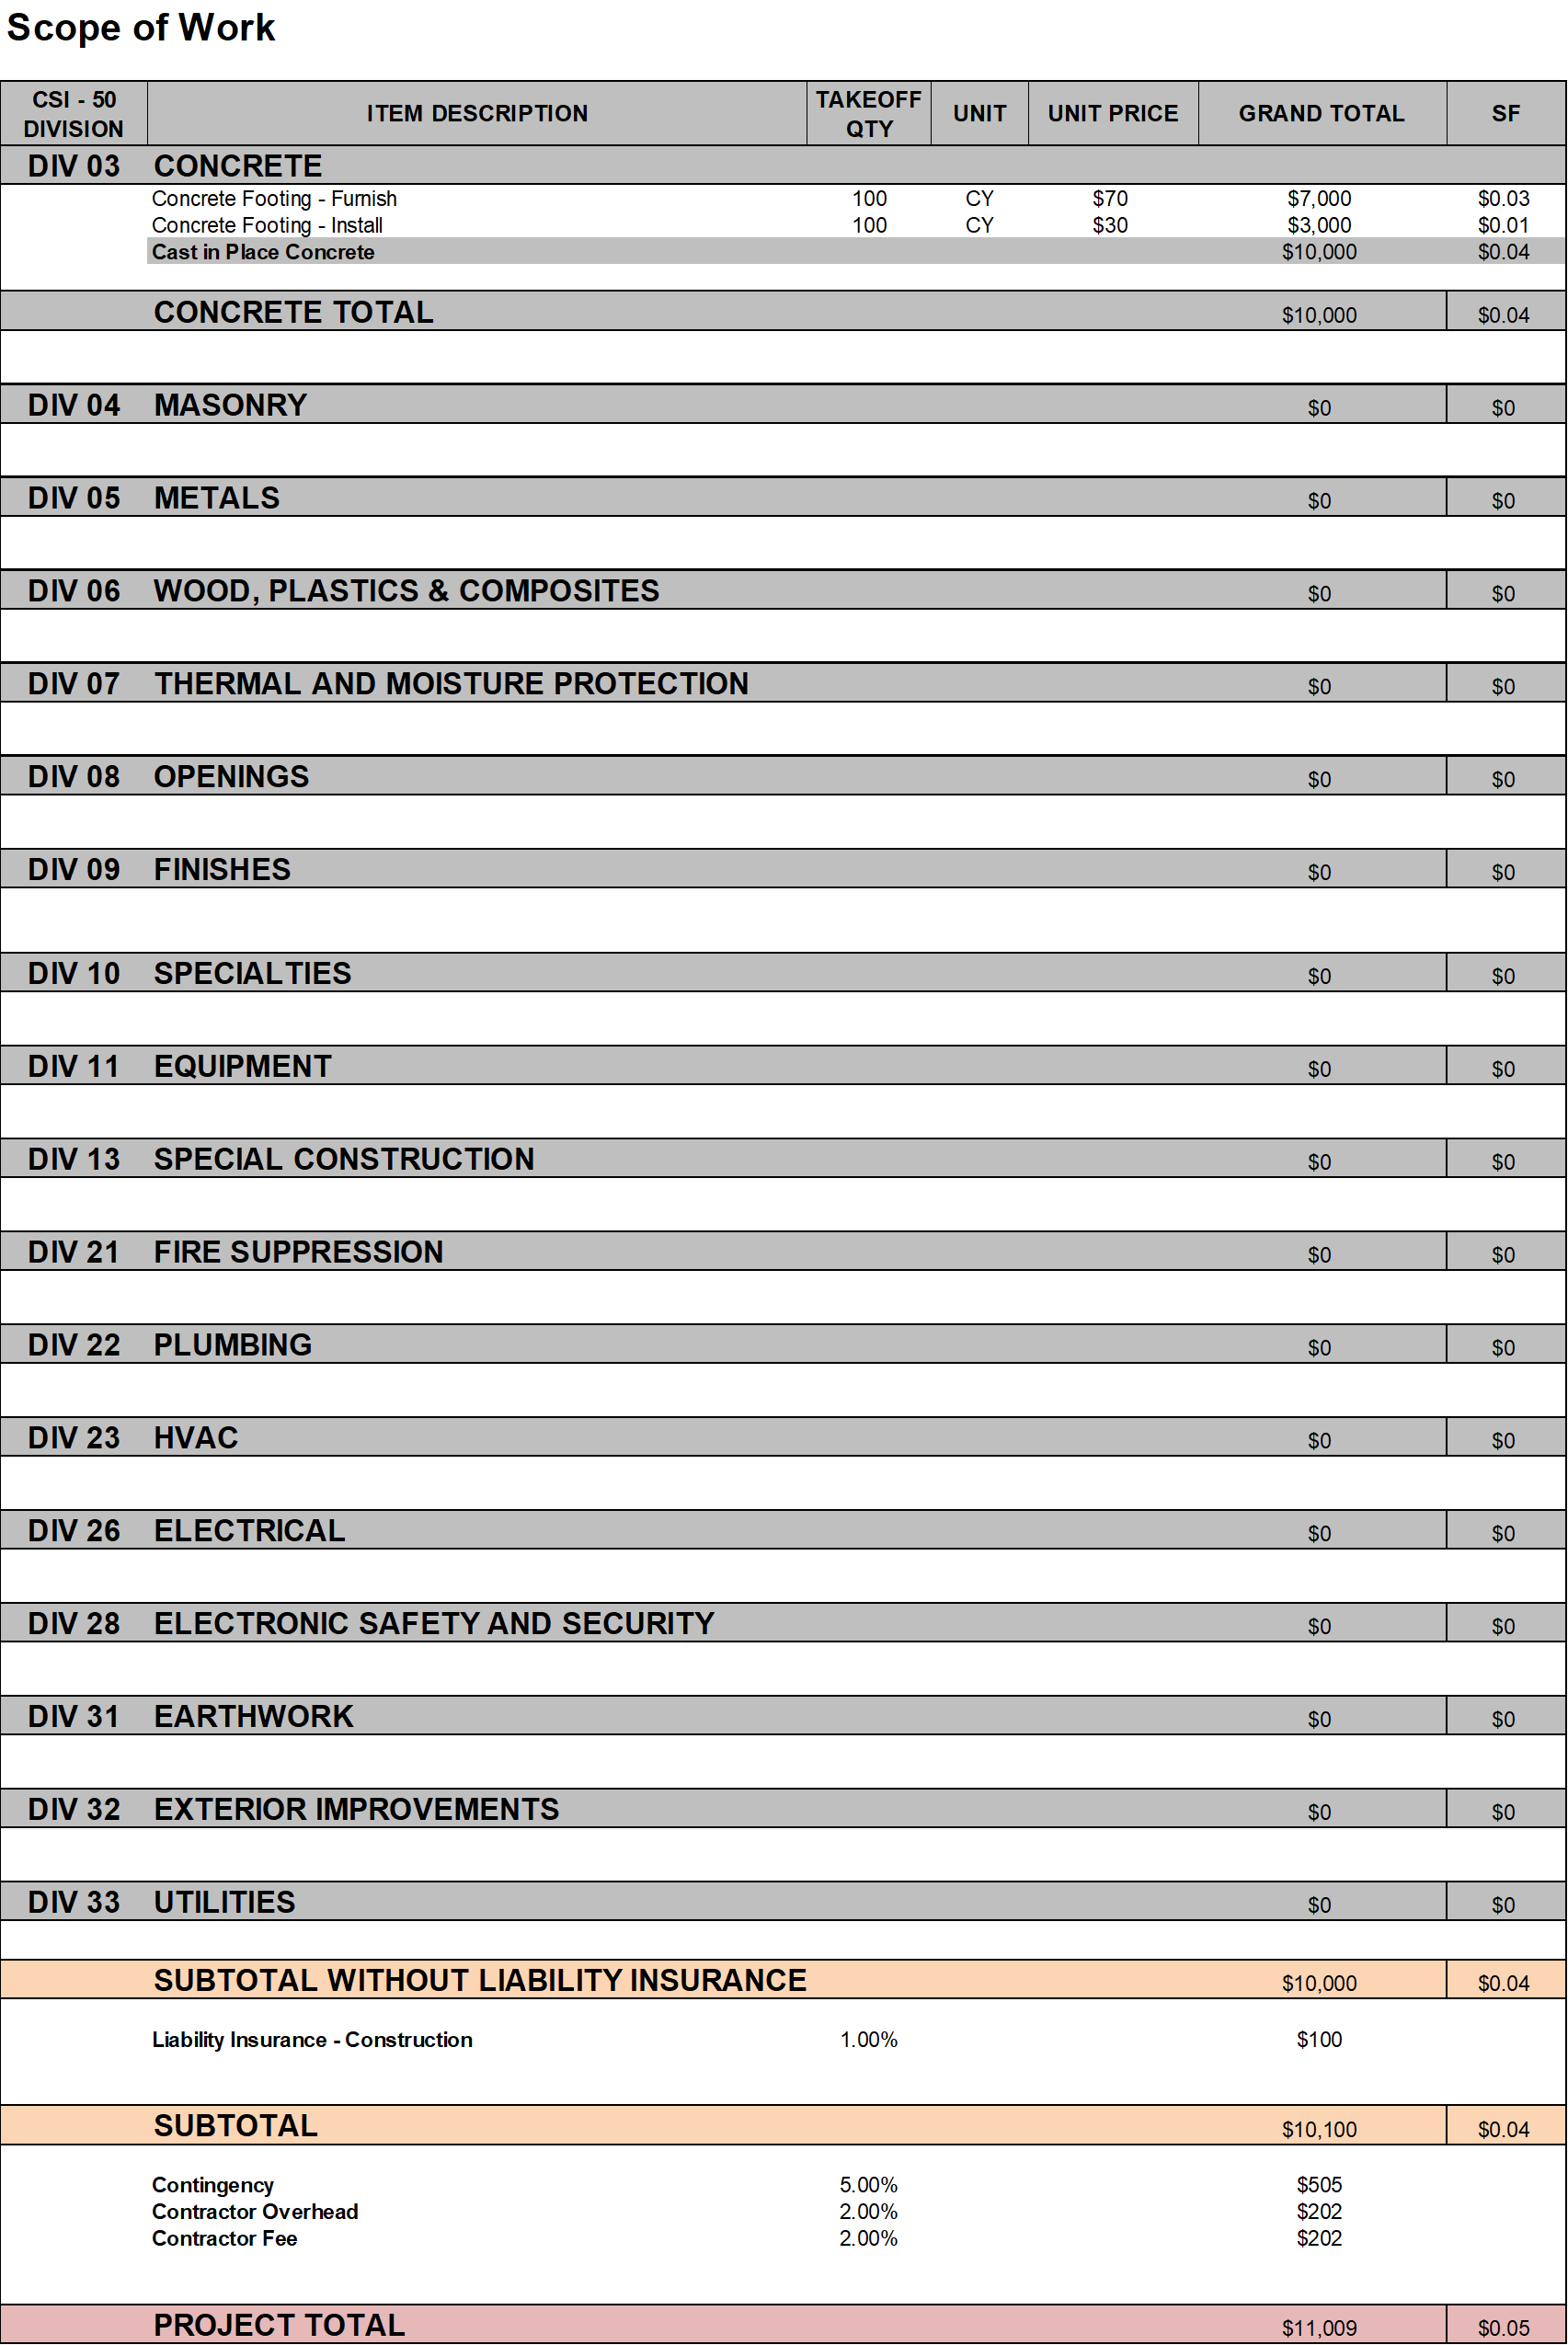
Always start with your raw version of the spreadsheet; use it like a check box to make sure you don’t miss any Scope of Work.
Let’s quickly run through some definitions:
- Construction Liability Insurance: protects your business from lawsuits or damages made by claims during the construction process.
- Contingency: Provisions for unforeseen events.
- Contractors Overhead: All costs associated to running the business (your business), but that cannot be allocated to any specific project, so it is distributed on a percentage basis to each project in work.
- Contractors Fee: Represents the company’s profit in this project.
Note that Construction Liability Insurance is always calculated first on the Subtotal of the Construction Project. Contingency, Overhead and Fee are then calculated simultaneously on the Sum of the Subtotal and the Liability Insurance. The percentages I have chosen are random, but not far from numbers I have seen in the past for this type of project.
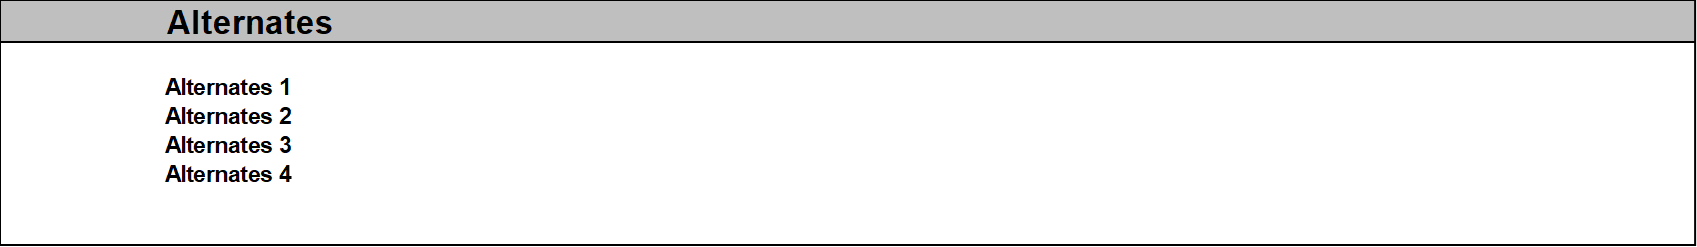
At last, list at the bottom of your spreadsheet any alternates. Alternates are “Design adjustments that are priced as separate additions or deletions to a base bid” (as per Alison Dykstra – Construction Project Management). These can be requested by the client but can also be alternates that you are proposing to the client.
Tip: It is very easy to miss construction items! At the beginning of every project skim through the 50 Division MasterFormat to identify items you may be missing and note them down. That effort can be really worth it!
Line Items
Your proposal will list each construction task/item as a single separate “line item” within its corresponding division and subcategory (as we have previously defined). As an example, the construction task Concrete Footing – Furnished and Installed will be listed in DIV 03 – Concrete under its subcategory Cast in Place Concrete. The line item includes information such as Takeoff Quantity, Unit, Unit Price and the calculated Total Cost of that line item.
The Units we will be using are mostly lengths, areas, volumes, counts, and lump sums. The Unit Price is essentially the total cost to build a single Unit of a particular construction task/ item. Labor costs, material costs, freight, taxes, subcontractor mark-ups, and other are all included within that number. Time is embedded within the Unit Price through labor costs (as best example), and other. Example: The need for overtime leads to higher overall labor costs, hence to a higher Unit Price.
The Unit Price is an extremely beneficial number that allows one to extrapolate the total construction cost of a task/ item with changing quantities (up to an extend of course). Therefore, it makes sense to generate that number be it through educated guessing, calculation, or a given number by a trusted source.
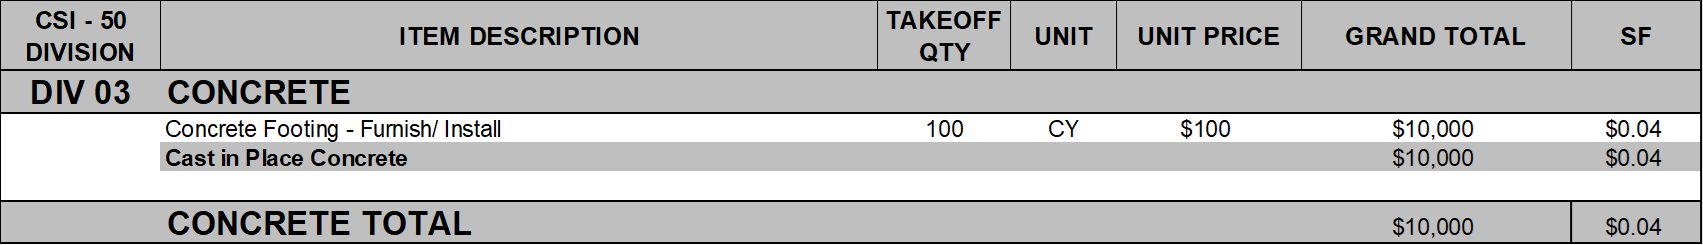
At times it can be beneficial to break a line item into several line items. The benefits are versatile, such as providing a higher accuracy and detail to the estimate by breaking overall costs into different components, highlighting items of discussion/concern, making numbers more comparable to incoming numbers, etc.
In our example, we want material delivery (furnish) and installation of our Concrete Footing to be handled by two independent subcontractors. We will receive independent pricing that we want to display separately. Therefore, we have broken the initial line item Concrete Footing – Furnish and Install into two – one item for furnish and one item for install as seen below.

Note that the overall quantities have not changed. 100 CY of concrete need to be furnished, and 100 CY of concrete need to be poured. Note that we are still assuming in sum a total cost of $10,000 with a 70/30 split (this our assumption). Until we get better information, we attempt to work with cost breakouts that are consistent with our initial convictions in pricing. In our case the argument can be made that pricing should be slightly higher because now there are two mobilizations instead of a one, additional coordination between subcontractors rather than a single subcontractor doing it all, etc. It is important to remember that the Unit Price is the total price to build a single Unit of a particular construction task/item – in our case the delivery of 1 CY of concrete, and the pouring of that 1 CY for the purpose of building a part of the concrete footing.
Tip: Sometimes less is more! If it is not really necessary, then do avoid breaking out line items. The intent is to be efficient, and more line items (i.e., more cost breakouts) evidently means more time spent. Furthermore, it is harder to be consistent with your initial pricing convictions as you can easily lose sight of the big picture.
The Power of Metrics – The Spreadsheets real Power
Let’s recap: the spreadsheet is the summary of all information available to you from a cost perspective, which is systematically organized for everyone’s understanding. This is one of the essential functions of the spreadsheet, but not the only one.
Construction items are listed within the spreadsheet as independent line items. Their respective Quantities and Unit Prices are multiplied to generate the Total Cost of that Line Item. All costs can now be summed in their corresponding subcategories, then divisions, then as a subtotal, and finally as a total construction cost (including, liability, contingency, overhead and fee) as seen in the spreadsheets above. Note that we are able to generate Square Foot Costs for divisions by dividing the sum with the known Square Foot Size of the building. If needed, we can calculate Square Foot Costs by individual construction item and also subcategory. We can generate sums for any grouped combination of line items. We can calculate comparable metrics, by dividing summed costs with the known Square Foot Size and Cubic Foot Size of the building, number of floors (if there is more than one), Building Perimeter, and more.
In short, with the help of our spreadsheet we can generate any type of metric to make our project, or just sections of the project comparable to outside information, such as incoming proposals, existing information on similar type projects, and more. We will pick this up at a later point more in detail.
Abbreviations
- F/I: Furnish and Install
- CY: Cubic Yard
- SF: Square Feet
